 |
A Carbon's Eye View of Molecular Dynamics in Benzene (2.23 Mb) QuickTime |
 |
Molecular Dynamics of Benzene (30 mode, 1st overtone) (5.70 Mb) QuickTime |
 |
Molecular Dynamics of Benzene (30 mode, 2nd overtone) (3.24 Mb) QuickTime |
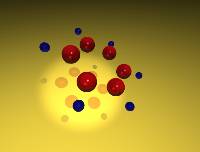
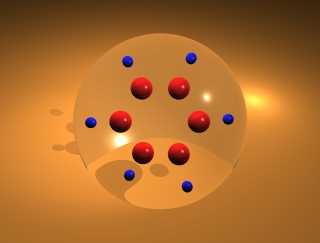
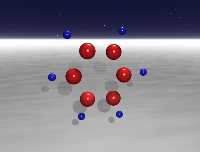
These animations depict studies of the classical vibrational dynamics of benzene. The molecular dynamics were computed using the most extensive ab initio force field for a polyatomic molecule from Maslen, Handy, Amos, and Jayatilaka 1. This force field contains fourth-order terms supplemented by fifth- and sixth-order terms by Wyatt and Iung2. The primitive direct product space has dimension 36.5 billion, which was reduced to an active space of 16,000 by use of the Wave Operator Sorting Algorithm3.
The study follows many possible trajectories of the molecule after excitation. (By the term trajectory, we refer to the (adiabatic) distribution of energy in a 21- or 30-dimensional space.) The trajectory of the molecule is determined by the initial conditions (potential and kinetic energy in each normal mode, corresponding to the position and momentum of each atom) and by various conditions imposed on the model. Each simulation begins by assigning a zero-point potential and kinetic energy value to each normal mode in the molecule; the proportion and phase are randomly selected. The next step is to add energy to the appropriate C-H stretch mode. From that point, the simulation follows the energetics of each mode of the 21- or 30-mode system. A large number of these cases are not physically viable (e.g. lead to a negative energy in one of the modes or lead to energy in a mode that exceeds the bond energy), and these cases are discarded. The remaining trajectories represent physically significant configurations. Each animation follows the course of one such trajectory.
Data from three different simulations are displayed. In the first animation, the motion of the molecule is constrained to a plane (i.e., 21-mode benzene4). In the other two animations, out-of-plane motion is allowed (i.e., 30-mode benzene5,6). The total duration of each of the full simulations is 2.4 picoseconds, though the short example animations below represent only small fractions of this interval. The interval of each time step is 200 a.u. (4.8 fs) for the studies.
In these animations, the small blue spheres denote the hydrogen atoms, and the red spheres denotes the carbon atoms.
|
A Carbon's Eye View of Molecular Dynamics in Benzene (2.23 Mb) QuickTime |
|
Molecular Dynamics of Benzene (30 mode, 1st overtone) (5.70 Mb) QuickTime |
|
Molecular Dynamics of Benzene (30 mode, 2nd overtone) (3.24 Mb) QuickTime |
The computations were performed by Todd J. Minehardt and Robert E. Wyatt using lonestar, a Cray T3E Massively Parallel Computer system. The computation required about 30 hours of dedicated time using 32 nodes of lonestar; the total computational time would be about 1,000 hours if the program were run on a single-processor computer. These animations were produced by J. David Adcock, a graduate student in the Wyatt research group. The graphics were rendered using the POV Ray Version 3.0.1 program. For more information, send e-mail to david@quantum.cm.utexas.edu.
References
1. P.E. Maslen, N.C. Handy, R.D. Amos, and D. Jayatilaka, J. Chem. Phys. 97,
4233 (1992).
2. R.E. Wyatt and C. Iung, J. Chem. Phys. 98, 6758 (1993).
3. C. Iung, C. Leforestier, and R.E. Wyatt, J. Chem. Phys. 98, 6722 (1993).
4. T.J.Minehardt and R.E. Wyatt, J. Chem. Phys. 109, 8330 (1998).
5. T.J.Minehardt and R.E. Wyatt, Chem. Phys. Lett. 295, 373 (1998).
6. T.J.Minehardt, J.D. Adcock, and R.E. Wyatt, Chem. Phys. Lett. 303, 537
(1999).
Last modified: October 1, 1999